
Currys plc is a business with solid foundations and significant competitive advantages. It has a clear strategy to increase free cashflow and a balance sheet that is now strong enough to return increasing amounts of surplus free cash flow to shareholders.
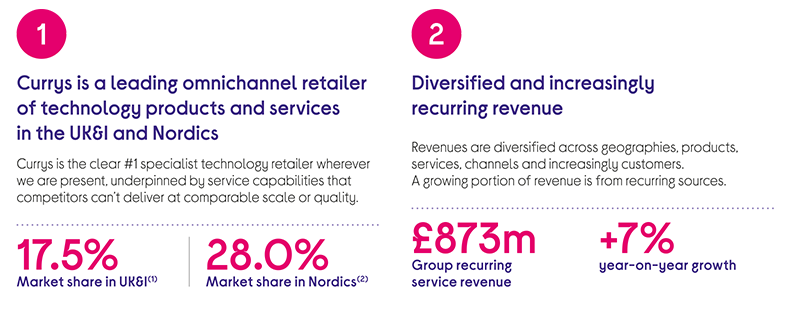
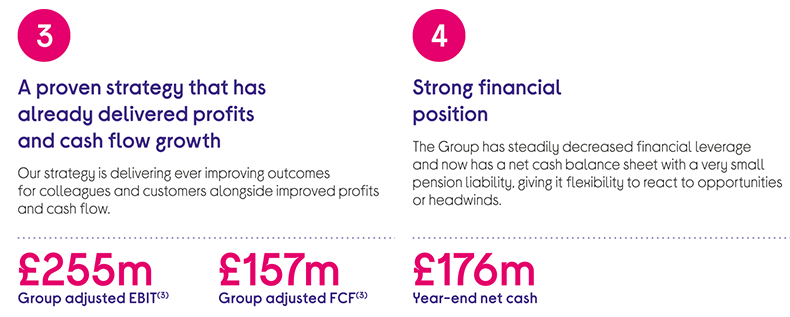
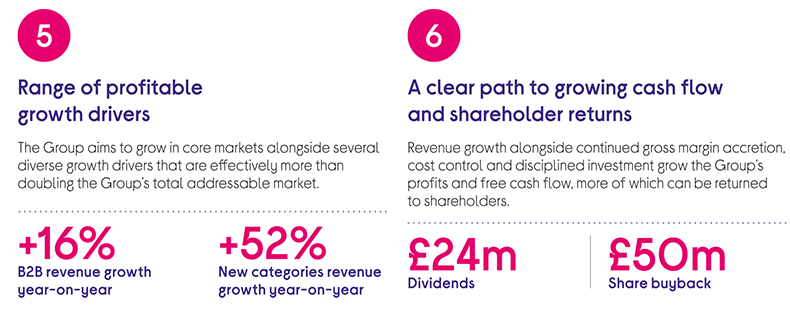
Sources: Currys internal information. Unless otherwise stated, all figures relate to FY 2025/26.
(1) NielsenIQ/GfK Point of Sales Tracking Service addressable market value data May 2025 to April 2026 mapped against Currys’ internal sales data.
(2) GfK Nordic May 2026.
(3) In the reporting of financial information, the Group uses certain measures that are not required under IFRS. These are presented in accordance with the Guidelines on Alternative Performance Measures (APMs) issued by the European Securities and Markets Authority (ESMA) and are consistent with those used internally by the Group’s Chief Operating Decision Maker (CODM) to evaluate trends, monitor performance, and forecast results. These APMs may not be directly comparable with other similarly titled measures of ‘adjusted’ or ‘underlying’ revenue or profit measures used by other companies, including those within our industry, and are not intended to be a substitute for, or superior to, IFRS measures.